Operon Browser
The Operon Browser is a tool that can simultaneously display the expression correlation between genes in Mycobacterium tuberculosis H37Rv while showing syntenic gene order in related species. A total of 1260 dual-dye microarray chips were used to compute the Pearson correlation coefficient across genes.
Enter a gene identifier and click the "GO" button to view this tool.
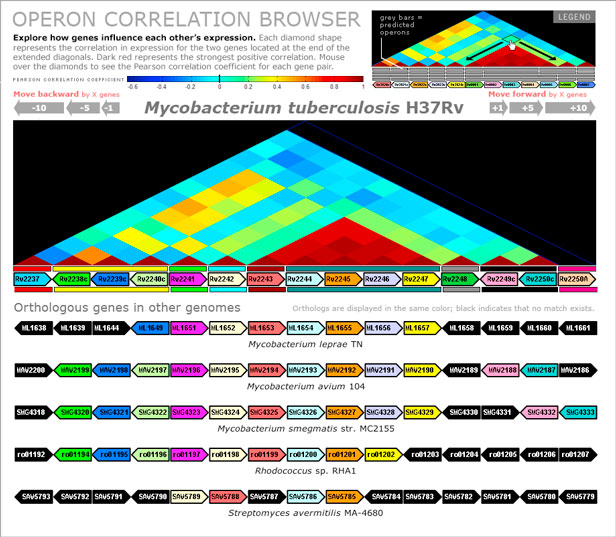
The browser is visually divided into three main sections including controls for navigation, a heatmap derived from expression correlation, and an alignment of syntentic areas. The top header houses the navigation and scaling key for the correlation matrix. The increasing size of the arrows allows the user to traverse the genome in 1, 5, or 10 gene long segmental jumps. The middle section displays a heatmap of the correlation matrix rotated along the diagonal to align with the genes below. Mousing over the diamonds on the heatmap displays the correlation between the pair of genes. The bottom section shows genome alignments to the reference genome. The genes directly below the correlation map is the reference genome, in this instance Mycobacterium tuberculosis H37Rv. The colored bars above and below the genes represent operon predictions. Colors associated with genes show orthologous relationships across different species. Genes in black indicate that an ortholog match was not found between the reference species and the genome of interest. Mousing over the genes reveals additional information including complete locus ID, gene symbol, and description.